Analytics dashboard
The analytics dashboard helps you measure and gain insight into your game's performance.
The analytics dashboard helps you measure and gain insight into your game's performance, which can give you the information you need to adjust marketing, content, and monetization strategies.
The dashboard includes key performance indicators (KPIs) for your game, including:
- Retention KPIs that measure how many users return to your game again after their first visit.
- Engagement KPIs that reflect how users actively use your game and represent your core user base.
- Acquisition statistics that show you the sources of users finding your game and how users from different sources convert.
- Demographics shows you the age, gender, country, and language of monthly active users who play your game.
- Feedback helps you monitor player/community comments and ratings.
- Monetization KPIs that help you understand the business performance of your game, as well as sales data that you can download and analyze in custom ways.
Any game with more than 10 daily active users (DAU) and 10 play hours for 7 consecutive days is eligible for accessing all KPIs on the dashboard.
Set up analytics dashboard#
If you are a game owner or a group owner, and your game meets the enrollment requirements, you can enroll in the analytics dashboard at any point with the following steps:
Make sure that you have a verified email address and a two-step verification method on your Roblox account.
Navigate to the game overview page on the Creator Dashboard.
Read Roblox Terms of Use and agree to them.
Now you have access to the main dashboard on the Overview and dashboards of all KPI categories, including Engagement, Retention, and Monetization.
If you don't want to activate the dashboard immediately, or you accidentally decline the Terms of Use, you can still use the Activate Analytics button on the game overview page to read the Terms of Use and agree to them any time. Refresh the page if you don't see the button.
For group game, only the group owner and members with sufficient permissions can view the analytics dashboard, as some metrics contain sensitive information. See roles and permissions for details on how to create a group role with access to the dashboard.
Dashboard functionality#
After activating the analytics dashboard, you can view the default charts on the overview and each KPI category. Hover over the Information Icon to understand what each chart represents and the View Icon to understand how to interpret the summary statistics on the top of each chart.
There are also functionalities on each dashboard to help you further analyze your game's performance, such as filtering by date, exporting charts, benchmarking, and viewing KPI Breakdowns.
Filter by date#
You can apply a date filter to view the chart for a date range by separately selecting any specific time frame between the first date that the data was available and the present day as the start and the end date. You can also click and drag on a chart to "zoom in" to a shorter time range across the page.
Filter by metrics#
You can apply various filters to better understand your cohorts by clicking the Filter By button. Filters apply to all charts across all analytics pages until they are turned off.
Some filters might not be available for all metrics. If a filter is not available, you will see that it is grayed out:
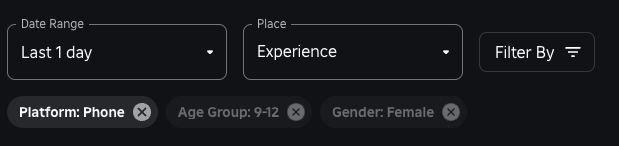
You can filter by the following metrics:
| Filter type | Example subcategories | Notes |
|---|---|---|
| Age group | <9, 9-12, 13-15, 18+, etc. | |
| Gender | Female, male, unknown | |
| Country | All countries | |
| Language | All languages | This filter can help you see the impact of adding translations for different languages. |
| Source | Home recommendation, search, teleports, sponsored ads, etc. | |
| When user first played | 0-30 days ago, 31-90 days ago, 91-180 days ago, 181-365 days ago, 365+ days ago, never | It's uncommon, but users can purchase a game pass and never actually play the game. You might see these users on the revenue chart. |
| Active payer status | Top 15%, intermediate 35%, casual 50%, lapsed, never | Percentile-based within your game, not a fixed value. Top 15% includes users who fall into the 85-100th percentile of spenders for your game, Intermediate 35% 50-84th, and Casual 50% 0-49th. Lapsed indicates users who haven't spent in the past 30 days, and Never is users who've never spent. Recalculated daily. See Platform spender status for status outside of your game. |
| Platform spender status | Active, other | Fixed value, not percentile-based. Active includes users who've spent $9.99 or more anywhere on Roblox in the last 60 days. Other includes all other users. This definition is consistent with the Creator Rewards program, so you can better understand the behavior of players who earn you Daily Engagement Rewards. |
| In-experience activity status | Early, active, lapsed, reactivated, never played | Based on play activity in your game. Early is the first 30 days after a user first plays. Active means the user played at least one session in the last 30 days and isn't Early or Reactivated. Lapsed means the user played no sessions in the last 30 days. Reactivated is the first 30 days after the user returns from being Lapsed. Never played means the user has never played the game. Recalculated daily. |
| User engagement | Inactive (0 days), low (1 day), medium (2-3 days), high (4-7 days) | Based on the number of days the user played your game in the last 7 days. Recalculated daily. |
| Platform activity status | New signup, active, lapsed, reactivated | Based on play activity across Roblox. New signup is the first 60 days after signup. Active means the user played at least one session in the last 60 days and isn't a New signup or Reactivated. Lapsed means the user played no sessions in the last 60 days. Reactivated is the first 60 days after the user returns from being Lapsed. Recalculated daily. |
| Platform | Computer, phone, tablet, console, VR | Users might be counted more than once if they use multiple devices. |
| OS (operating system) | Android, iOS, Windows, macOS, PlayStation, etc. | Users might be counted more than once if they use multiple devices. |
| Memory group (only applicable to some performance metrics) | <2 GB, 2-4 GB, 4-8 GB, >8 GB | Can help you identify devices that aren't performing well in your game. |
Explore#
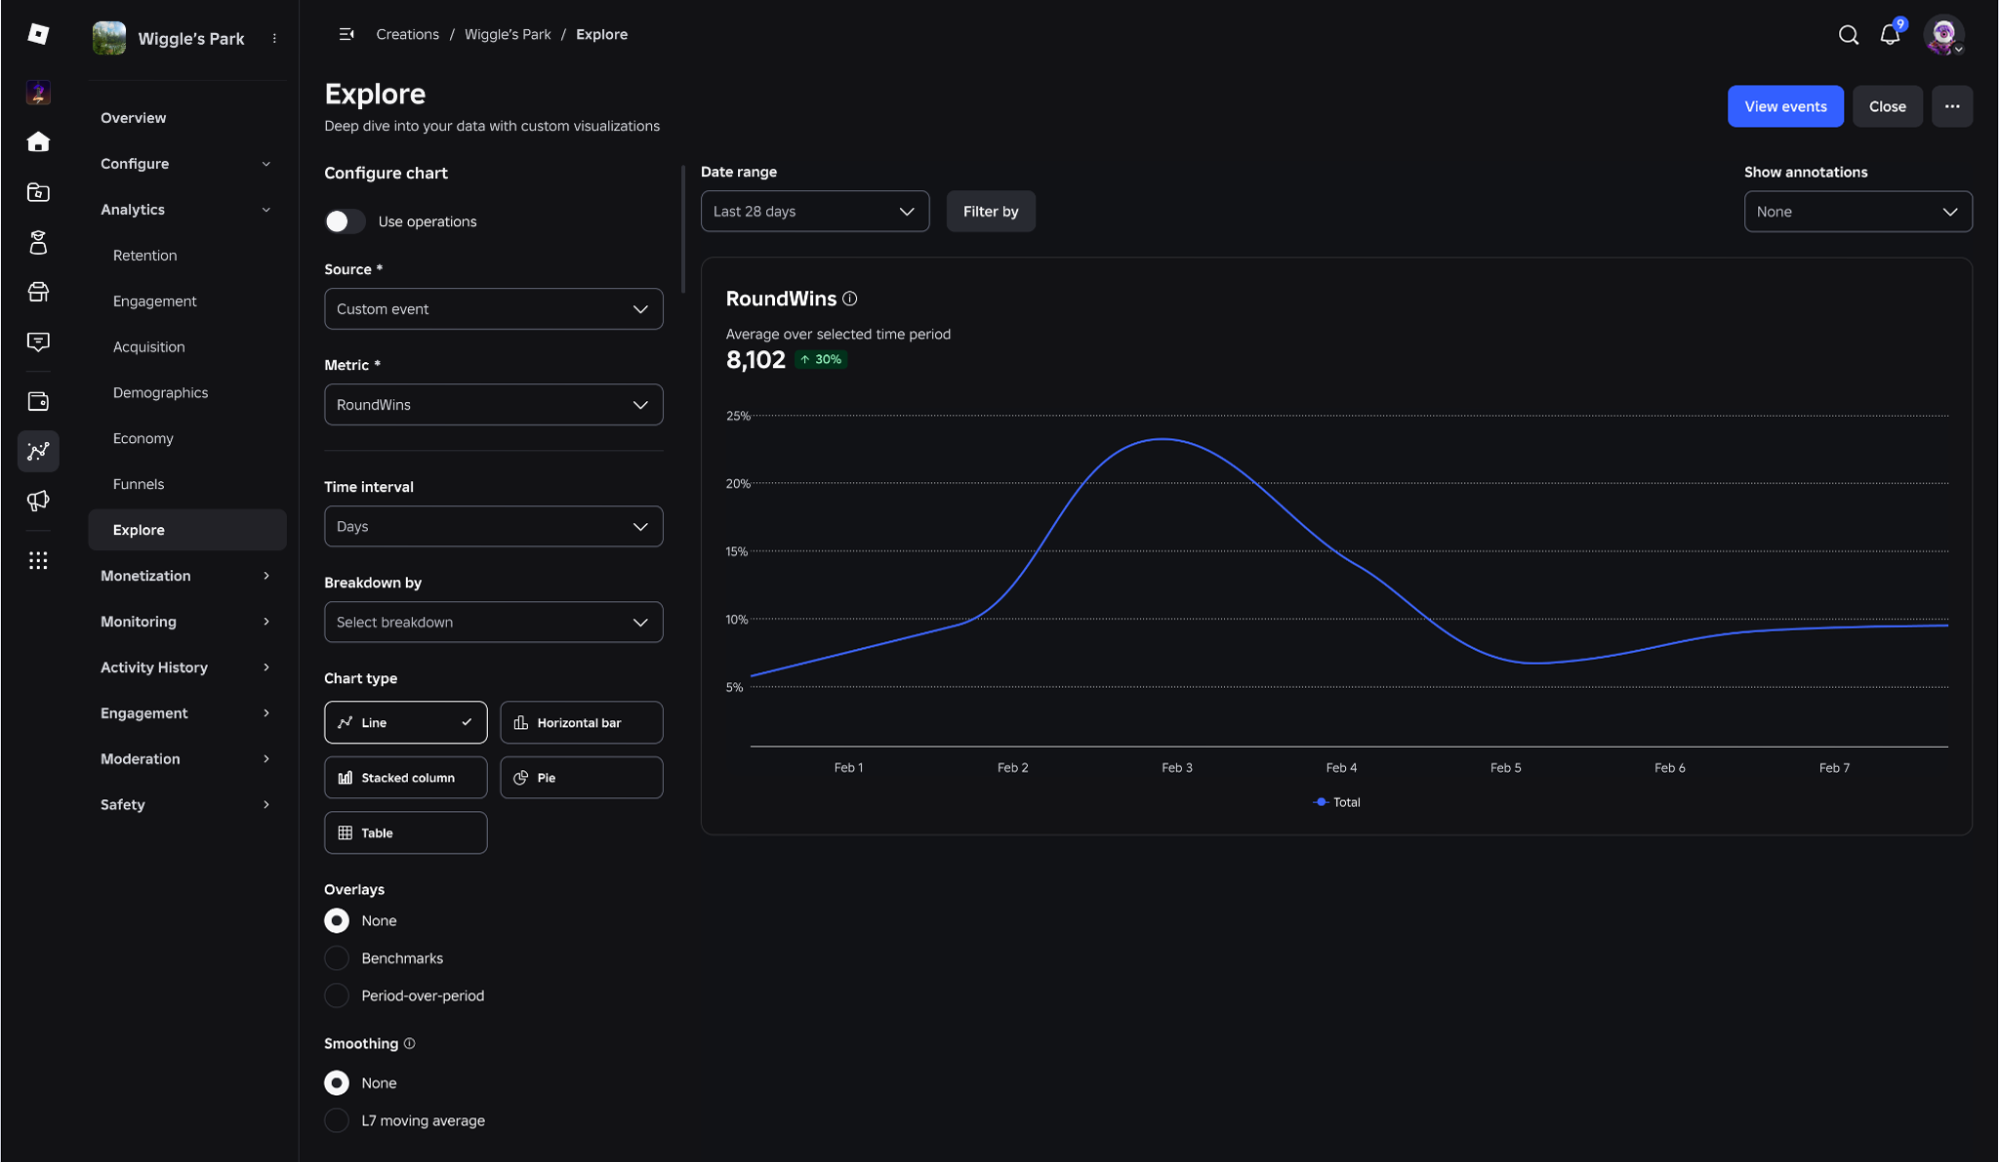
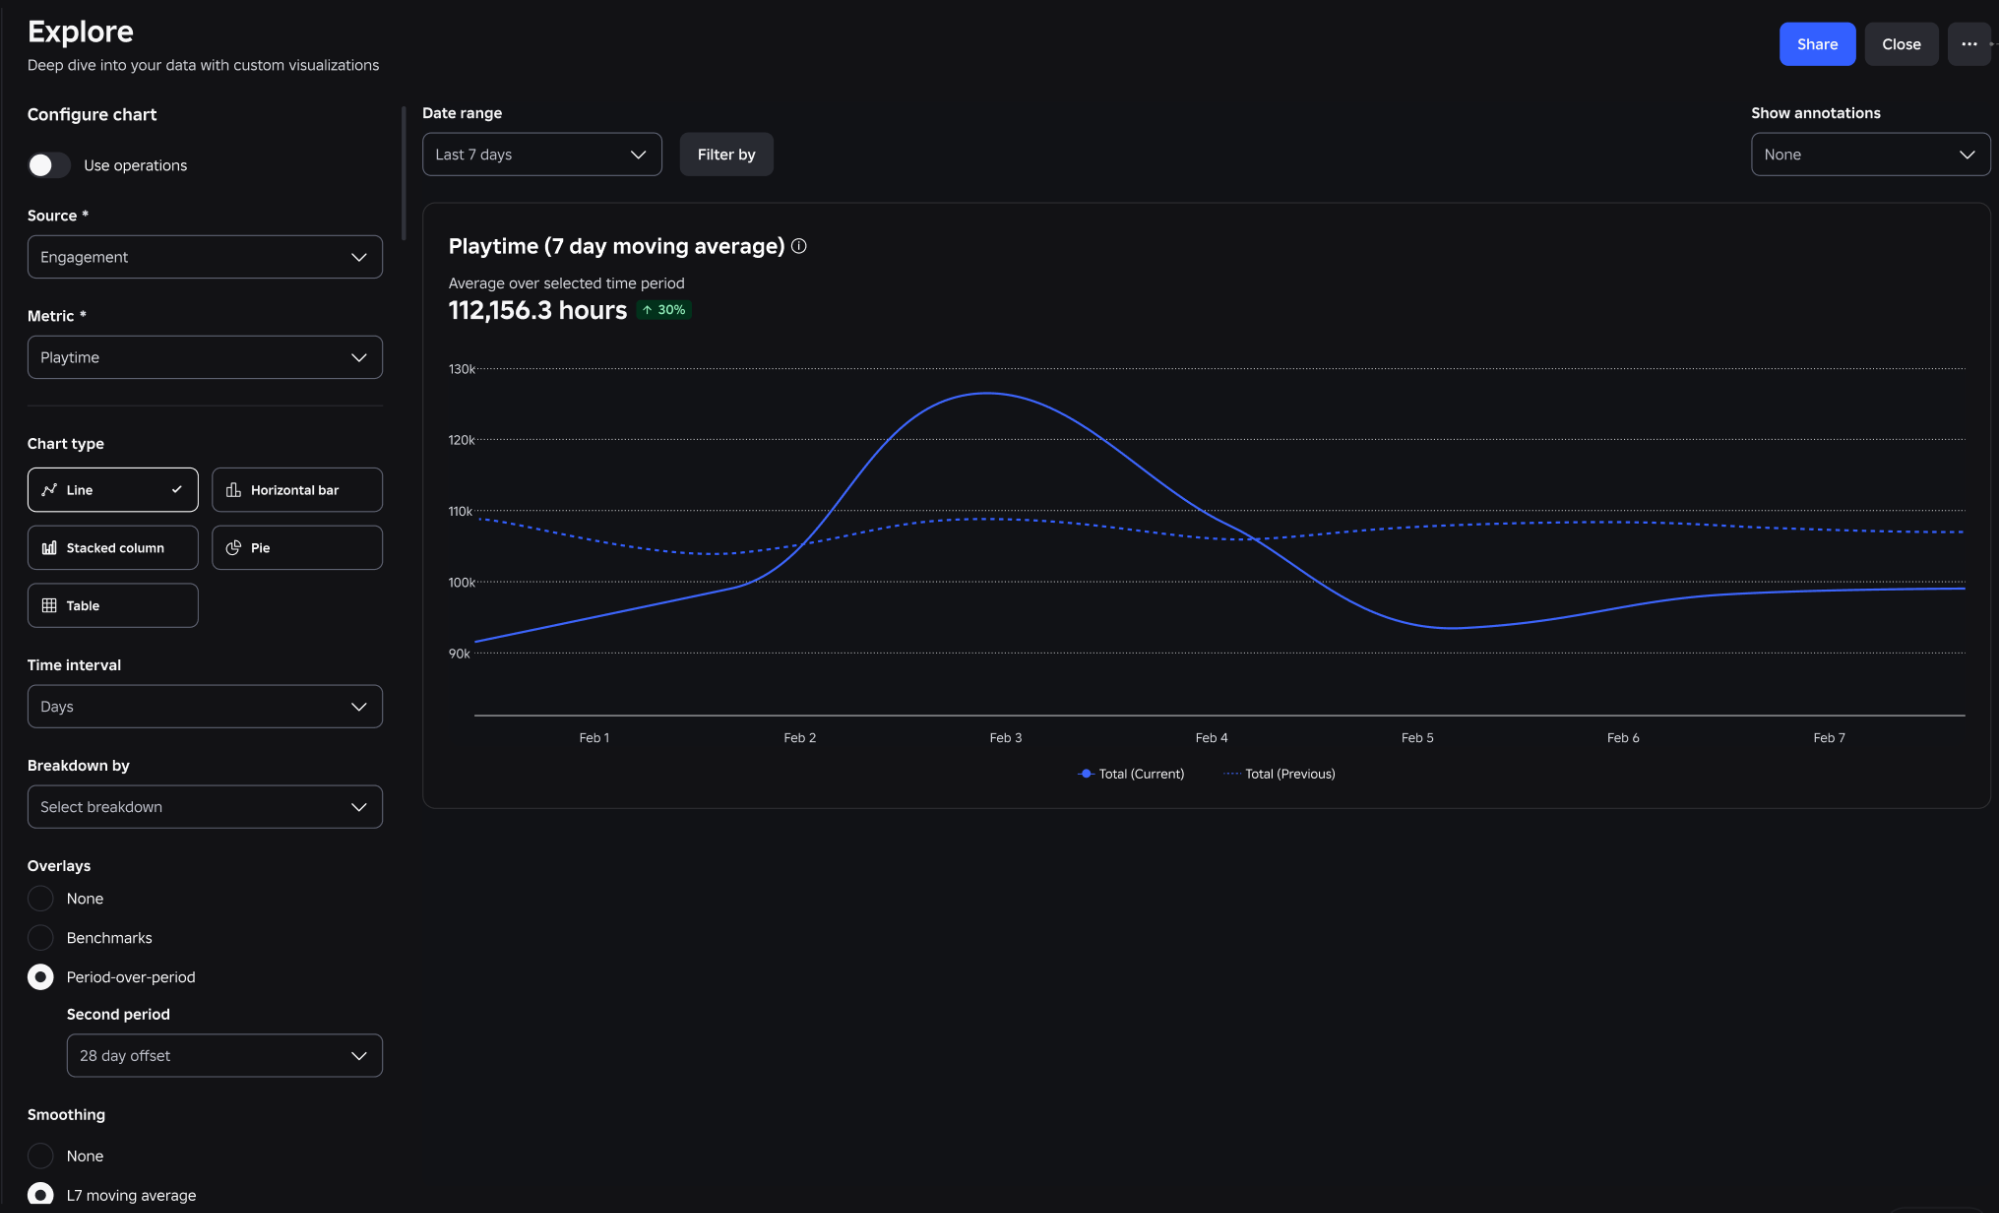
The Explore page lets you deep-dive into your data with custom visualizations. Use it to build charts from custom events or standard metrics, define formulas to calculate new metrics, overlay benchmarks and prior periods, and compare segments in custom tables. You can reach the Explore page from:
- The Explore tab in the Analytics left navigation.
- The Explore button on the top-right corner of any chart on the dashboard.
- A benchmark scorecard on the Overview page.
Configure a chart#
The Configure chart panel controls what the chart plots. Choose a Source (for example, Engagement or a custom event) and a Metric, then refine with:
- Time interval — Days, weeks, or cumulative.
- Breakdown by — Split the chart by a segment such as platform, age group, or custom field.
- Filter by — Narrow the data to specific segment values.
If you are using custom fields, you can filter and break down custom metrics by dimensions unique to your game.
Chart types#
Pick the chart type that best fits the question you're asking:
| Type | Best for |
|---|---|
| Line | Trends over time — how a metric fluctuates day to day. |
| Horizontal bar | Comparing performance across breakdown values, such as cumulative playtime by platform. |
| Stacked column | Composition — how parts make up a whole, like total kills by weapon type. |
| Pie | Distribution — a quick snapshot of how a total splits across segments. |
| Table | Snapshots of multiple metrics side-by-side across breakdowns. |
Stacked column and pie charts aren't available for averages or ratios.
Calculated metrics#
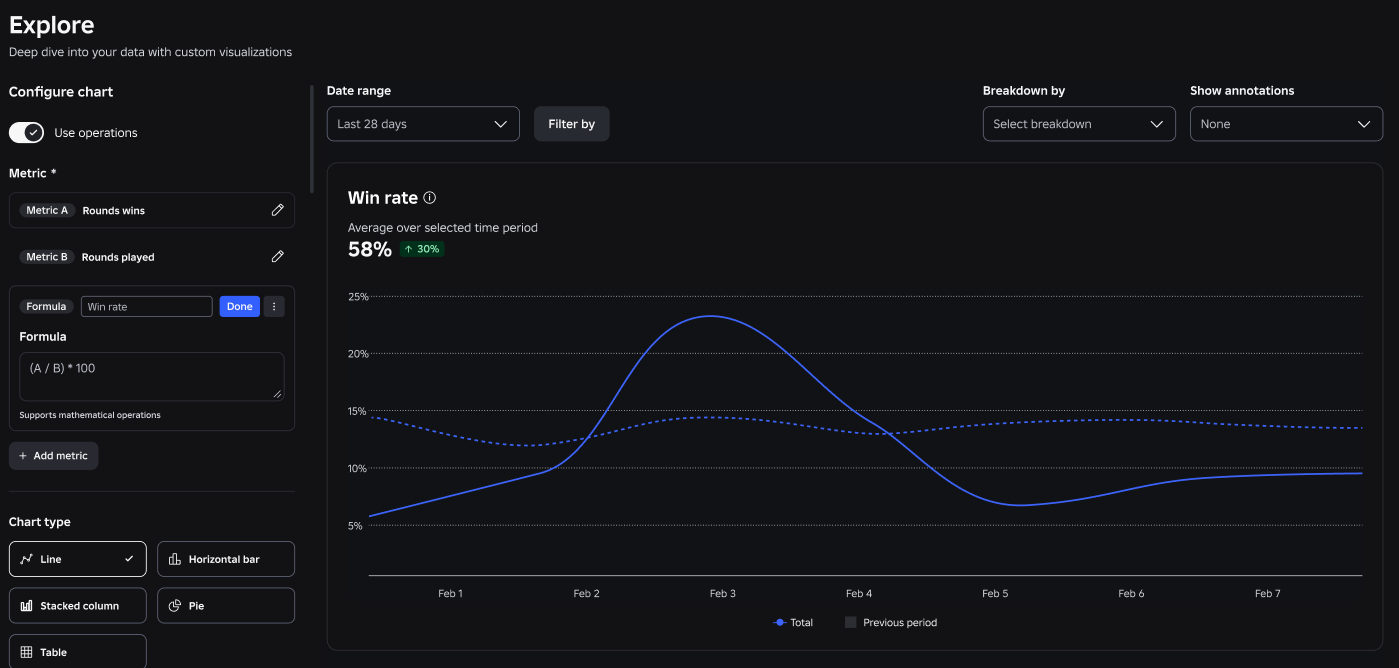
Toggle Use operations in the Configure chart panel to build metrics from multiple inputs using math operators.
- Define your variables — Add the metrics or custom events you want to combine (
Metric A,Metric B, and so on). - Define your formula — Combine them with
+,-,*,/, and constants, for example(A / B) * 100.
Common use cases:
- Win rate —
RoundWins / RoundsPlayedto see how difficulty changes over time. - Economy health —
CurrencySources - CurrencySinksto monitor inflation in real time. - Engagement ratios —
EquippedWeapon / TotalPlayersto understand feature adoption.
Custom tables#
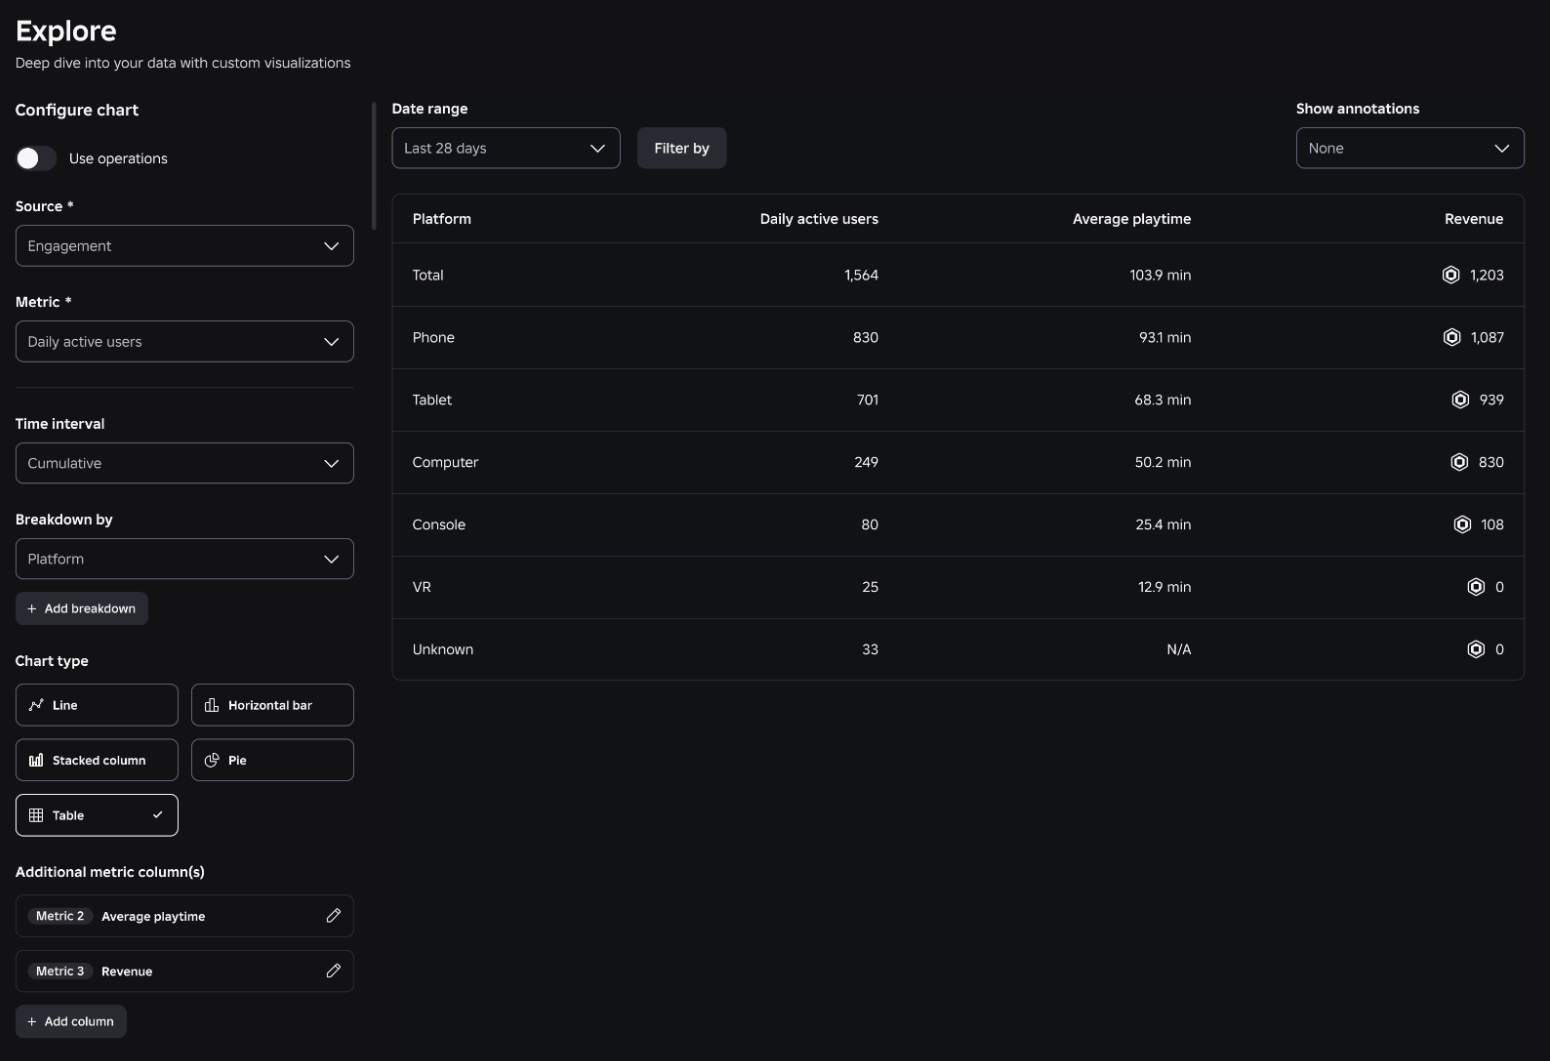
Choose the Table chart type to view multiple metrics together. Tables support:
- Row breakdowns — Group rows by date (daily, weekly, cumulative) or by a segment such as platform, age, or spender status.
- Additional metric columns — Add more metrics to see a snapshot of performance across different breakdowns. Each metric should support the breakdown applied to the table.
Overlays and smoothing#
Use Overlays and Smoothing to understand how your metrics are trending:
- Benchmarks — Overlay the benchmark for your game alongside your own data. See Benchmarking for how benchmarks are selected.
- Period-over-period — Plot a prior time window on the same chart to compare against recent performance. Choose the offset (for example, a 28-day offset).
- 7-day moving average — Apply smoothing to remove weekly seasonality and surface the underlying trend.
Share a chart#
Once you've configured a chart, the URL reflects your selections. Bookmark it for later or share it with teammates to open the same view.
Export a chart#
To export a chart to use with other data analytics tools, click the Export Button and save the metrics in a .csv file. The file includes timestamps and values of each datapoint per KPI.
You can't export the chart data for the given KPI chart if you don't have any data for your game. This is due to either you enroll in the dashboard for less than 48 hours or you don't have any users for the given timeframe.
Benchmarking#
Benchmarking is the process of measuring your game's KPIs and comparing them to other games on Roblox. With benchmarks displayed on your dashboard, you can monitor the performance of your game's analytics KPIs among games on Roblox to adjust your content strategy and set appropriate goals for improvement.
For KPIs relevant to specific aspects of your user behavior, the analytics dashboard provides benchmarks for games with similar players. Depending on the availability, you might see:
- Games with similar players if the model finds enough games enjoyed by players that are similar to yours, such as those on the recommended games section on your Game Details Page.
- Genre benchmarks if the model cannot find enough similar games but your game has an internal genre.
- All experiences benchmarks if your game hasn't been labeled with a genre yet.
Your game may transition from one benchmark set to another as we gather more data to help you compare your game with the most relevant games with at least 100 daily active users. Benchmarks for similar games update daily to reflect the most relevant games for your user base.
When your benchmark sets update, such as Genre updating to Experiences with similar players, the dashboard adds annotations in the charts to identify when your game transitions from one benchmark set to another.
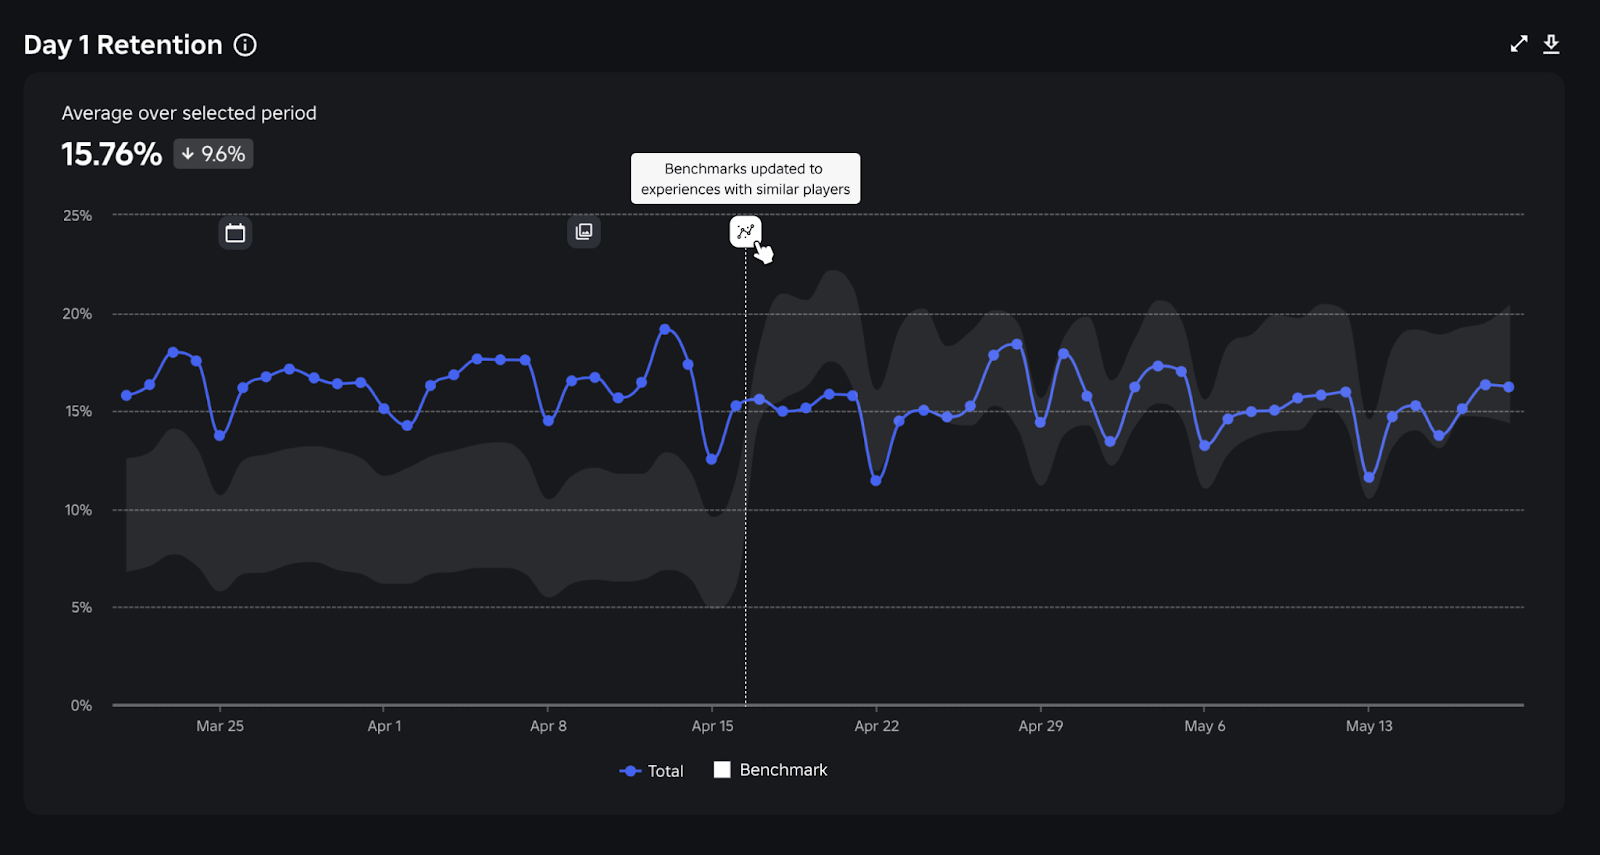
Available KPIs for similar game benchmarks include:
- Retention - All KPIs
- Engagement- Average Session Time
- Monetization - Average Revenue per Paying Users (ARPPU), Average Revenue per DAU (ARPDAU), Conversion Rate (CVR)
- Acquisition - Play Through Rate
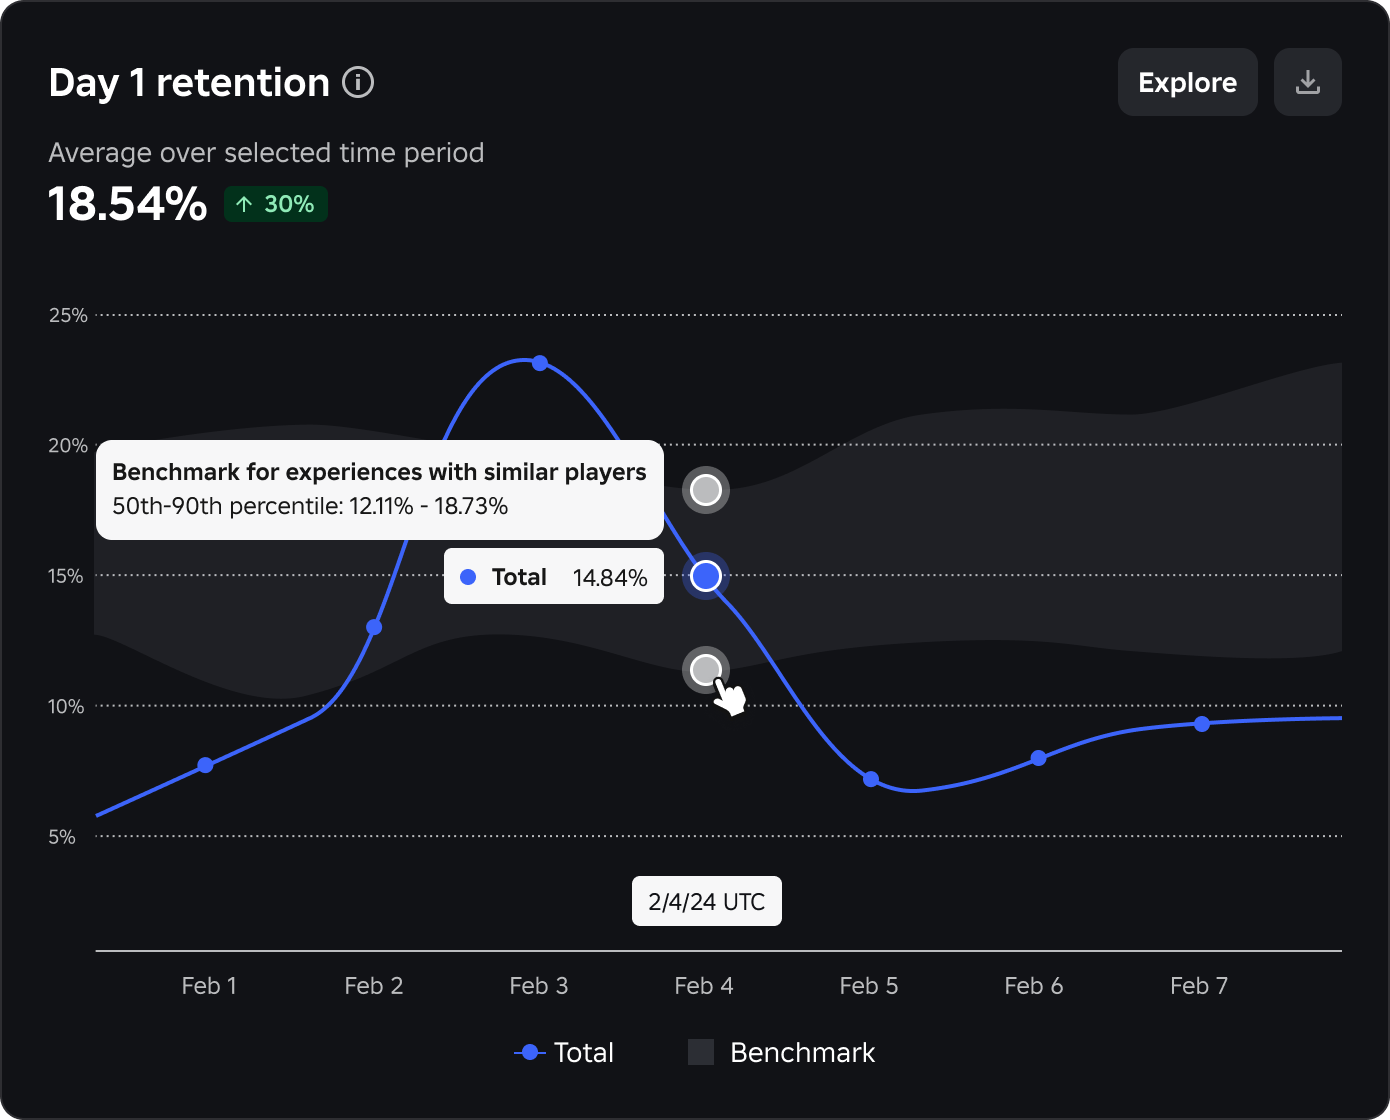
Each of these KPIs shows its similar game benchmark in the 50th - 90th percentile range. For example, if you see your Day 1 Retention benchmark's 50th - 90th percentile is 12.11% - 18.73%, it means that:
- 50% of games with similar players have a Day 1 Retention of 12.11% or lower.
- 10% of games with similar players have a Day 1 Retention of 18.73% or higher.
For KPIs on your game's overall success, the analytics dashboard uses the top 1000 games with the highest total playtime over a rolling 30 days as the benchmarking pool, excluding games that are less than 30 days old. Each of these KPIs has Top 200, Top 500, and Top 1000 as benchmarking tiers. The dashboard displays the appropriate tier for your game based on your game's engagement metrics and updates them on a daily basis.
View KPI breakdowns#
You can apply a breakdown to analyze each chart in a more specific category by clicking the Breakdown by and toggling between the breakdown types, including Age Group, Platform, OS, Country, and Language. The following table explains the subcategories and usage of each breakdown type. You might also see an "Unknown" subcategory that refers to users without relevant data.
| Breakdown by | Subcategory examples | Notes |
|---|---|---|
| Age group | <9, 9-12, 13-15, 18+, etc. | |
| Gender | Female, male, unknown | |
| Top countries | The top five countries where your game has the most daily active users | Also includes an "other" category and total DAU. |
| Top languages | The top five languages where your game has the most daily active users | Also includes an "other" category and total DAU. |
| Source | Home recommendation, search, teleports, sponsored ads, etc. | |
| When user first played | 0-30 days ago, 31-90 days ago, 91-180 days ago, 181-365 days ago, 365+ days ago, never | It's uncommon, but users can purchase a game pass and never actually play the game. You might see these users on the revenue chart. |
| Active payer status | Top 15%, intermediate 35%, casual 50%, lapsed, never | Percentile-based within your game, not a fixed value. Top 15% includes users who fall into the 85-100th percentile of spenders for your game, Intermediate 35% 50-84th, and Casual 50% 0-49th. Lapsed indicates users who haven't spent in the past 30 days, and Never is users who've never spent. Recalculated daily. See Platform spender status for status outside of your game. |
| Platform spender status | Active, other | Fixed value, not percentile-based. Active includes users who've spent $9.99 or more anywhere on Roblox in the last 60 days. Other includes all other users. This definition is consistent with the Creator Rewards program, so you can better understand the behavior of players who earn you Daily Engagement Rewards. |
| In-experience activity status | Early, active, lapsed, reactivated, never played | Based on play activity in your game. Early is the first 30 days after a user first plays. Active means the user played at least one session in the last 30 days and isn't Early or Reactivated. Lapsed means the user played no sessions in the last 30 days. Reactivated is the first 30 days after the user returns from being Lapsed. Never played means the user has never played the game. Recalculated daily. |
| User engagement | Inactive (0 days), low (1 day), medium (2-3 days), high (4-7 days) | Based on the number of days the user played your game in the last 7 days. Recalculated daily. |
| Platform activity status | New signup, active, lapsed, reactivated | Based on play activity across Roblox. New signup is the first 60 days after signup. Active means the user played at least one session in the last 60 days and isn't a New signup or Reactivated. Lapsed means the user played no sessions in the last 60 days. Reactivated is the first 60 days after the user returns from being Lapsed. Recalculated daily. |
| Platform | Computer, phone, tablet, console, VR | Users might be counted more than once if they use multiple devices. |
| OS (operating system) | Android, iOS, Windows, macOS, PlayStation, etc. | Users might be counted more than once if they use multiple devices. |
When viewing a breakdown on a chart, you can click on the value in the legend to toggle the line on and off, or double click on one value in the chart's legend to view only that line.
Sales data#
Sales data download is one of the Roblox analytics offerings that can help you view and analyze your asset and developer product sales in your desired way.
Access sales data#
Roblox automatically generates a .csv (comma-separated values) file for your sales data and updates it every 48 hours. You can download and customize it to fit your analytics tactics. To access the file:
In your Account Info Settings, add and verify your email address for receiving the data download link.
In your Security Settings, set up an Authenticator App as the 2-Step Verification method for your account.
Navigate to your or your group's transactions page.
- For your personal sales data, navigate to the My Transactions page.
- For your group's sales data:
- Navigate to the Groups page and select the target group.
- Click the ⋯ button on the group banner and select Configure Group.
- In the navigation menu, hover over Revenue to show the dropdown and then select Sales.
From the Type of Transaction dropdown, select Sales of Goods. Then click the Download Data button.
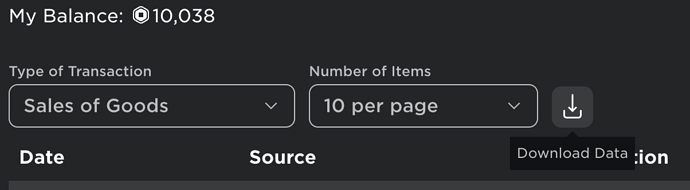
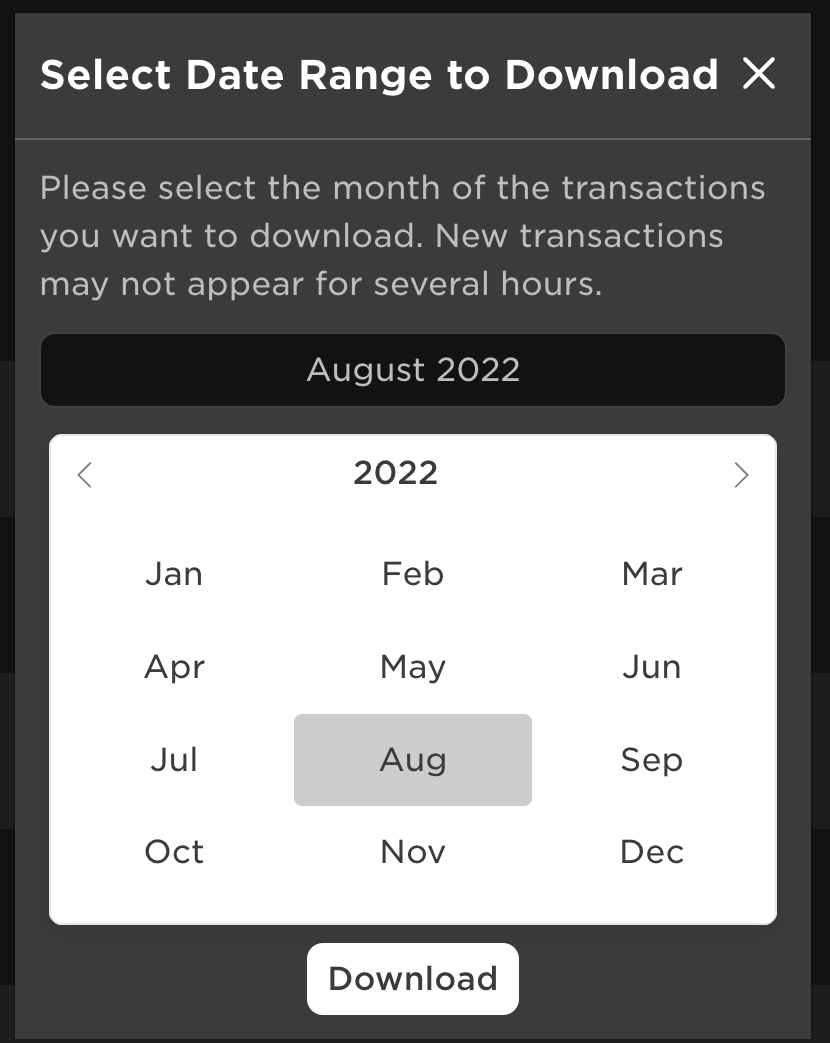
On the prompted calendar, select a calendar month of sales data to download. You can choose any month from the current date to up to two years ago. If you choose the current month, the file will include all available data of the partial month.
In the inbox of your verified email address, you receive an email with a link to download a
.zipfile that contains your sales data in.csvformat. The link will expire after 48 hours.You can use the
.csvsales data sheet to analyze the data in your desired way to meet your specific business needs. For example, you can filter to display only sale records with pending Robux to release to you, so you can calculate the timeline and amount of your sales payout to make decisions on when to exchange earned Robux for real-world currency (DevEx) or pay your collaborators.
Sales data attributes#
On the .csv sales data sheet, each sold item has the following attributes and metrics:
| Attribute | Description | Example |
|---|---|---|
| Buyer User ID | User ID of the user who purchased the item. | 123456789 |
| Sale Date and Time | Date and time of the transaction in UTC. | 2022-07-15T19:04:30.397Z |
| Sale Location | The location in which the user bought the item, such as a game and the Marketplace. | WebSite, Marketplace, Game |
| Universe ID | The unique identifier of the game that the purchased item belongs to. Only applicable for items that belong to a game, like a pass. | 987654321 |
| Universe | The name of the game that the purchased item belongs to. Only applicable for items that belong to a game, like a pass. | My Awesome Game |
| Asset ID | The unique identifier of the item. | 234565432 |
| Asset Name | The name of the item. | My Avatar Shirt, My Server |
| Asset Type | The type of the item, which can be a Roblox asset type or a developer product type. | Game Pass, Private Server, Mesh |
| Hold Status | The status of whether Robux from this sale have been released to you or are still in a hold. | Released, Held, Cancelled |
| Revenue | The amount of Robux you receive for the purchase, which is the item listing price excluding any Marketplace fees, Affiliate Fees, and Recurring Group Payouts. | 50 |
| Price | The item listing price, which is the amount of Robux that the buyer paid for the purchase. | 10 |